[Updated w/second graph]
Jonathan Weisberg (Toronto) posted this graph on social media today (compiled from the 2017 ADPA report):
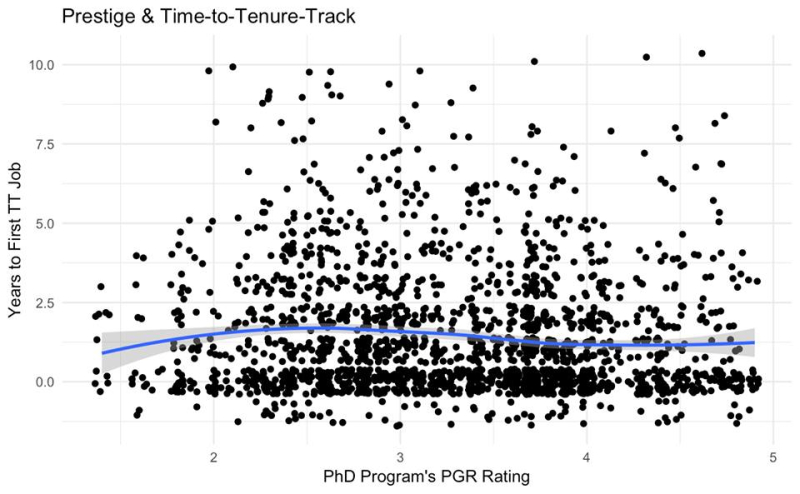
There are a number of things interesting about this graph…
First, there isn't that much difference in the average time to getting a TT job from across the PGR. All across the spectrum, the average time to first TT job is somewhere between 1-2 years. However, a closer look at the graph reveals some other interesting things.
The second interesting thing about this graph is that the shortest average times to TT job are for graduates from PhD programs rated a 4 or 5 (which are top-ten programs in the Leiter report) but also programs ranked lower than 2 (which are unranked programs). In fact, although there are fewer data points, graduates from unranked programs (at the far left of the graph) appear to have the shortest average time to first TT job. Note that this coheres with data from the ADPA job-placement report, which indicated that unranked programs such as Baylor, Oregon, Florida, and Cincinnati have some of the highest placement rates of all graduate programs.
Third, the programs that appear to have the longest average-time-to-TT job are those rated between 2 and 3.5, which correspond to programs ranked 20-50 in the Leiter report. Incidentally, this corresponds to the hypothesis I ventured a while back that graduates from mid-ranked programs may have the most trouble on the job-market because they are trying to compete with PGR top-20 graduates for R1 jobs (a generally losing proposition), while at the same time potentially pricing themselves out of teaching jobs by focusing so much on research.
Fourth, it's interesting to me that in the entire graph, the least amount of variance appears to occur for graduates from programs rated lower than 2. In this part of the graph, every person who got their first TT job did so in about 5 years or less–something we find nowhere else on the graph. There also appears to be less variance on the far right side of the graph. Finally, though, the most amount of variance appears for programs rated between 2-3.5 (again, graduates from schools ranked 20-50 in the Leiter report). This also coheres with my hypothesis that graduates from these programs may have the most difficult time on the market.
Finally, it is worth reflecting on the fact that although a good number of candidates get their first TT job in their first year out (there is a lot of clustering at the bottom of the graph), a fairly large number of candidates take between two and seven years to get their first TT job. A lesson here, I think, is that grad students and candidates really need to disabuse themselves of the notion that they should expect a TT job in their first year or two out. If you head to grad school or head out on the market expecting to get a job in your first year or two, you have unrealistic expectations. Yes, quite a lot of candidates do get jobs that quickly–but a heck of a lot do not!
UPDATE: here's an interesting second graph Weisberg shared that is zoomed out and includes extreme outliers removed from the first graph.
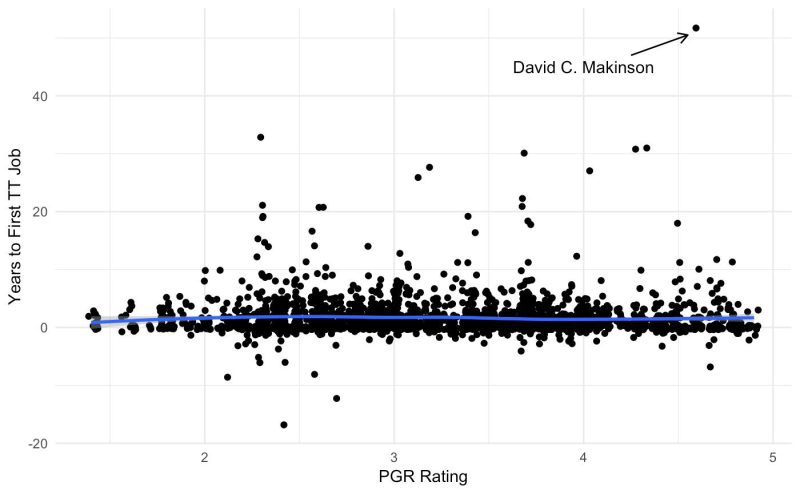
Yes, that's right: this graph reports significant numbers of individuals who received TT jobs well before receiving the PhD, as well as people who got their first TT job after 20+ years on the market, including one person it apparently took 50 years. (!)
Leave a Reply